Data Availability and Supplementary Information
To access any information that is not directly available on this page, please see our documentation in this link.
SUMMARY OF KEY RESULTS
The main focus of this project is on testing out each functional component of the NanoStoma, therefore proving the feasibility of our mechanism of action (MoA).
First, we annealed and imaged the NanoStoma DNA origami structure and confirmed that folding occurred as designed (see Assembly and Confirmation, and DNA Origami Purification).
Next, we characterized the degree of stacking of the NanoStoma in different conditions (see Stacking Characterization).
After that, we tested the mechanism of our locking system by using toehold-mediated strand displacement first instead of the azobenzene-based system (see Locking Mechanism)
Finally, we inserted cholesterol-modified DNA into our DNA origami structure and confirmed the formation of a hydrophobic local environment around the slit (see Integration of Cholesterol).
To validate feasibility in the context of application in a soap bubble’s membrane, we designed a simple experiment to prove that DNA origami may in fact be efficiently inserted into the membrane without much compromise to the membrane’s integrity (see Integration of DNA into Soap Bubble).
STRUCTURE ASSEMBLY AND CONFIRMATION
Background:
In folding DNA origami, each structure has its own optimum conditions that have to be determined empirically. The conditions usually involve two major factors: salt conditions and temperature ramps. Salt conditions, specifically cation concentrations, determine the degree of cancellation of DNA’s innate negative charge, which allows more DNA to properly anneal due to the lower resulting negative-negative repulsion between the strands. Temperature ramps, on the other hand, regulate the degree of hybridization temporally, as DNA will naturally anneal starting from the longer complementary segment—which possess higher melting temperatures (Tm). Proper time control of annealing is necessary for all complementary segments to form double helices. In other words, each temperature threshold must be passed through with sufficient time so that the long complementary segments hybridize successfully before the short complementary segments hybridize.
Materials and Methods:
This section describes the details of the DNA origami folding.
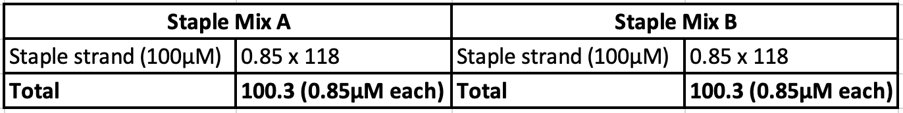
Staple strands were mixed and separated into two staple mixes: Staple A and B
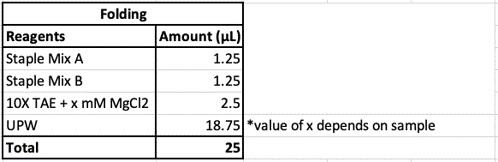
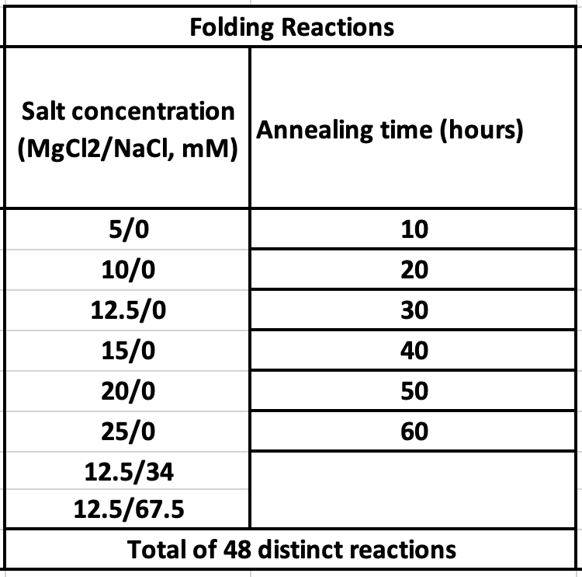
Eight different salt conditions and six different temperature ramps were performed, resulting in a total number of 48 samples. 25μL reactions were set up for each sample with a scaffold concentration of 10nM and total staple concentration of 50nM. Temperature ramps were set up as a decrease of 0.2°C with different intervals according to the ramp. Annealed samples were kept at 4°C until further processing.
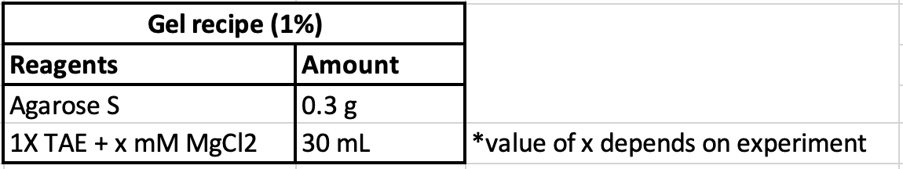
Confirmation of successful annealing and optimal annealing conditions were done using agarose gel electrophoresis and atomic force microscopy (AFM). Agarose gel electrophoresis was performed using 1% agarose gel with 1X TAE + Mg as the running buffer, done at 50V at 4°C. Gels are then imaged through SYBR Gold staining and UV transillumination. AFM was performed using 1nM samples under the indicated imaging buffer conditions.

Results and Discussion:
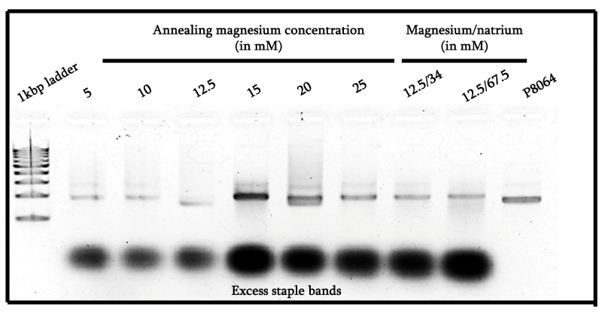
From Figure 1, we can see that in general all of the magnesium concentration options were in fact capable of allowing the formation of some sort of origami structure. In particular interest, the ones that were annealed in 15mM and 20mM of magnesium seemed to indicate good results, the 15mM one showed a very intense band. Meanwhile, the 20mM showed some smearing to the heavier molecular weight side that is not visible in any other lanes, indicating that some stacking possibly occurred.
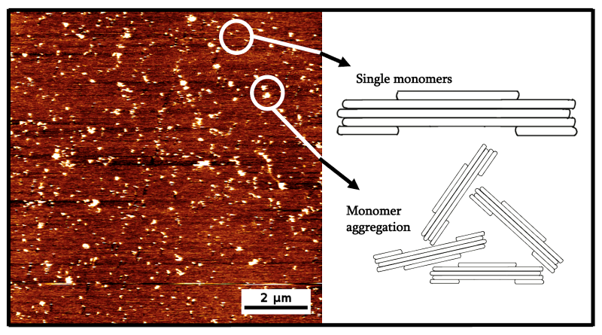
From Figure 2, we can see that clear artifacts were observed. Out of these images, we have classified them into two categories. The first one being the isolated intended monomers while the other one is aggregations of the monomers. For the aggregation, it may have occurred due to the sample being too concentrated or the buffer containing too high of a cation content.
DNA ORIGAMI PURIFICATION
Background:
In order to maximize quality of results in other experiments, we decided to purify identified samples in order to remove excess staple that could result in lowering experiments’ validity.
Materials and Methods:
Samples that were to be purified were diluted to a lower concentration of magnesium ion (4mM) before proceeding to use a centrifugation-based molecular weight cutoff (MWCO) purification kit per the instruction manual. After purification, the magnesium concentration of each sample was restored to its original value. Purified samples were kept at 4°C until further processing.
STACKING CHARACTERIZATION
Background:
To confirm the ability of our monomers to stack on their own, we decided to implement both agarose gel electrophoresis and AFM-based observation to characterize the ability and degree of stacking according to different buffer conditions.
Materials and Methods:
To induce stacking, we incubated the DNA origami samples in a 20mM buffer and proceeded to run the agarose gel electrophoresis as per the conditions described previously with a running buffer of 1X TAE + 20mM Mg. AFM was performed using origami samples that were diluted to a concentration of 1nM under the indicated imaging buffer conditions.
Results and Discussion:
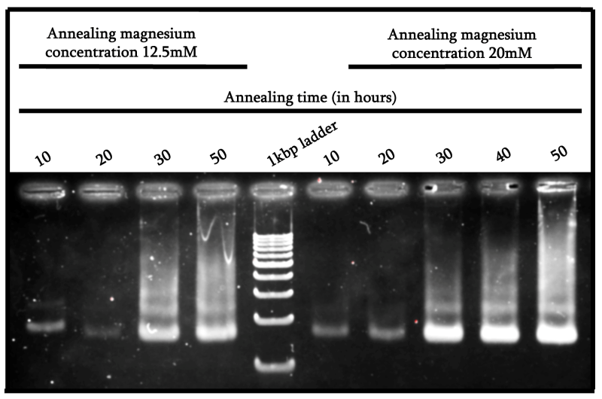
From Figure 3, we can see that the samples annealed within a timeframe of 30 to 50 hours seemed to achieve the intended structure and therefore show stacking. From this result, we can prove again that the most ideal condition for our structure is with the 50-hour annealing time in a 20mM magnesium buffer, as it shows the strongest band with the most amount of stacking.
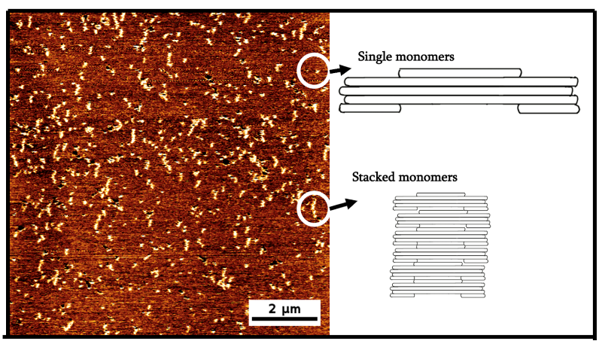
From Figure 4, we can see that again, the observed structures can be roughly divided into single monomers or stacked monomers. Unlike the aggregation observed in the 12.5mM imaging buffer condition, the grouped structures are neat and form a clear long structure, indicative of successful vertical stacking.
LOCKING MECHANISM
Background:
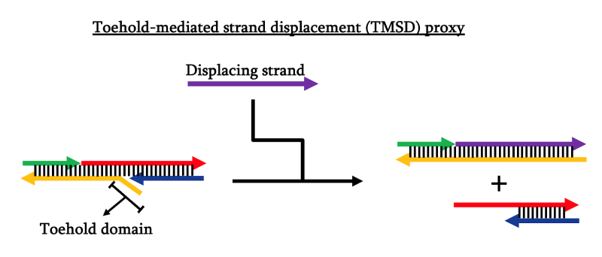
To test out the design of our blocker DNA, we decided to make a prototype that works on toehold-mediated strand displacement (TMSD) reaction and test the successful induction of lock dissociation using polyacrylamide gel electrophoresis (PAGE).
Materials and Methods:
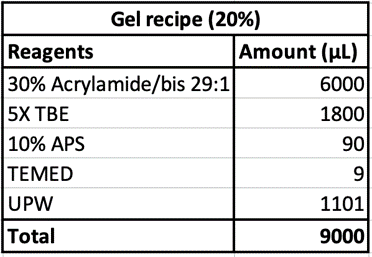
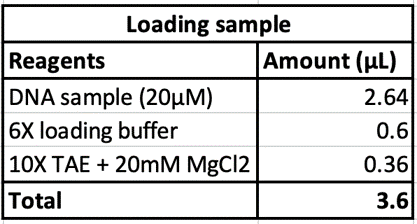
Polyacrylamide gel electrophoresis was performed using 16% acrylamide gel with 1X TBE as the running buffer, done at 50V at 4°C. Gels are then imaged through SYBR Gold staining and UV transillumination.
Results and Discussion:
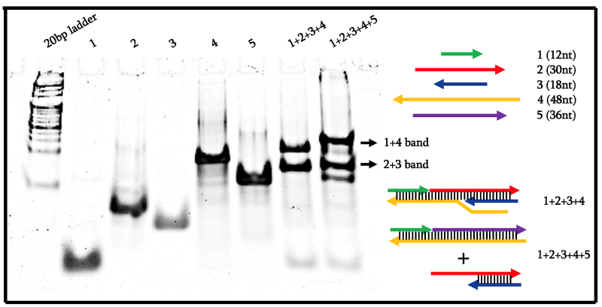
From Figure 6, we can see that by using our original design of the blocker strand number 2 being 30nt, the largest structure of 1+2+3+4 could not form and did not result in a band. Consequently, the 1+2+3+4+5 lane also showed a similar banding pattern as no strand displacement reaction occurred. As such, we redesigned the system by increasing the length of strand number 2 to be 34nt in length.
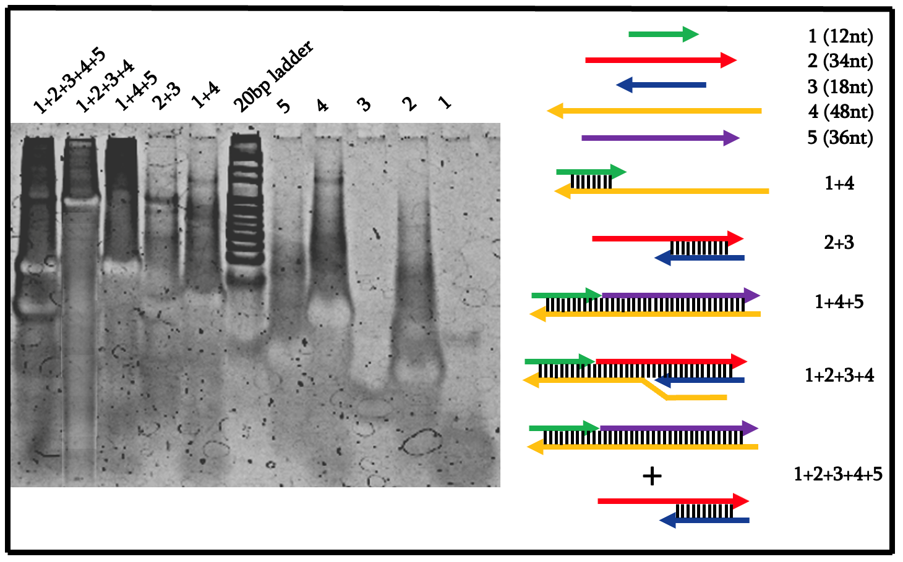
From Figure 7, we can see that indeed, each lane showed bands of the expected molecular weight. In particular, we can see that the 1+2+3+4 lane resulted in a high molecular weight band that is not present in the 1+2+3+4+5 lane. Instead, only two bands appeared in that lane which corresponds to the intended 1+4+5 and 2+3 bands. As such, we can conclude that the locking mechanism worked as intended and is ready to be replicated in an azobenzene-controlled fashion.
CONFIRMATION OF CHOLESTEROL INTEGRATION
Background:
To realize the hydrophobic environment, we annealed another DNA origami batch using the optimum parameters we found and integrated cholesterol-modified DNA into the annealing mix. For confirmation of hydrophobicity, we also integrated DNA that also has fluorophore (FAM) into our structure.
Materials and Methods:
We developed an assay to test the hydrophobicity as below. Holes were punched out from a silicon plate using a biopsy punch before the silicon plate was transferred on top of a slide glass. 1.5μL of the DNA solution was pipetted onto the created hole such that the solution covers about half of the diameter and a clear air-solution boundary is formed when seen from above. One piece of cover glass was then placed on top of the droplet to prevent evaporation during observation.
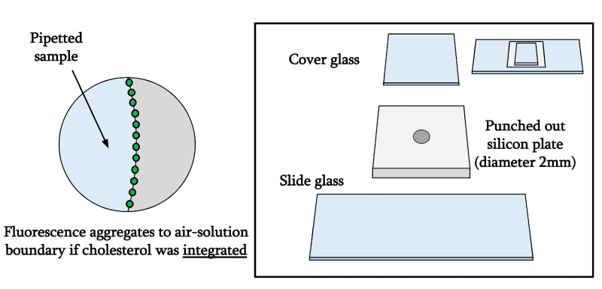
The whole construct is imaged using fluorescent confocal microscopy that was set to excite and detect FAM fluorescence.
Results and Discussion:
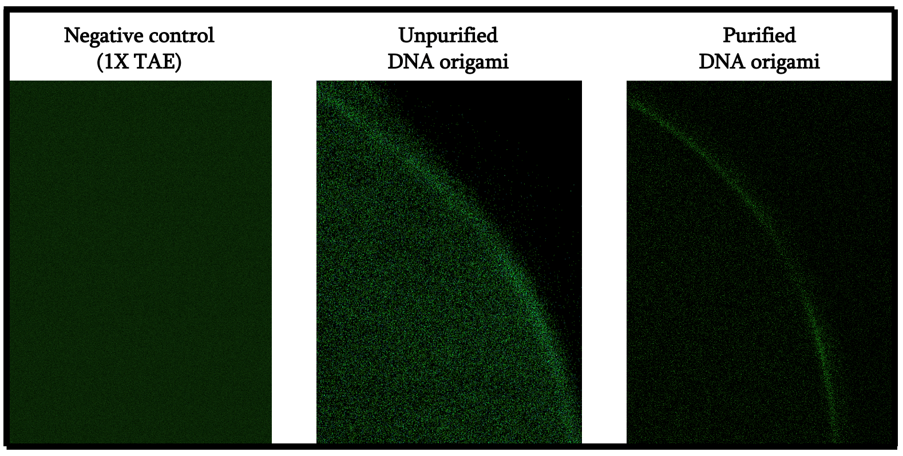
From Figure 9, we can indeed see that the fluorescence aggregated on the air-solution boundary of the droplet. Comparing the unpurified and purified samples, we can infer that most of the fluorescence that was seen inside the droplet in the unpurified sample was a result of excess staples. As such, we can infer that the creation of a local hydrophobic environment that spans through the origami structure was indeed successful.
INTEGRATION OF DNA INTO SOAP BUBBLE
Background:
We then wanted a definite proof that indeed DNA with molecular weights similar to our structure would be able to insert itself independently into the membrane of a soap bubble. We also wanted to confirm whether insertion of DNA has any effect on the structural integrity of the bubble itself.
Materials and Methods:
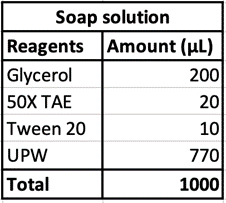
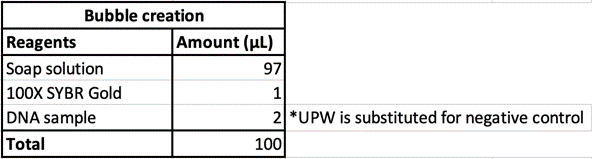
100μL of DNA-inserted soap solution was pipetted onto a slide glass. With a pipette set to 75μL, air is pipetted into the droplet of solution, creating a bubble. The slide glass was then placed in a UV transilluminator to visualize the fluorescence. In the case of confocal microscopy, the slide glass was imaged using a confocal microscope to perform optical sectioning and achieve 3D reconstruction.
Results and Discussion:

From Figure 10, we can see that indeed, the background fluorescence of SYBR Gold was intensified due to DNA binding not just on the base of the bubble where solution gathers naturally, but also in the membrane. As such, we conclude that yes, it is in fact possible to insert origami-sized DNA into the membrane of a soap bubble.
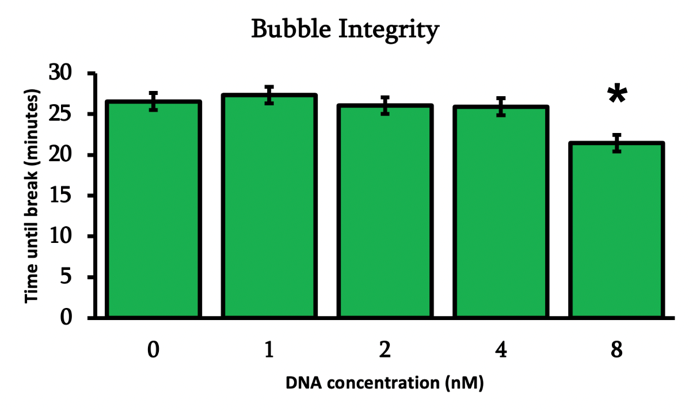
From Figure 11, we can see that the bubble integrity is considerably high. The effect of DNA concentration to the time of breaking was only statistically significant when the DNA inside reaches concentrations above 8nM. In general, the integrity of a soap bubble can be modified by adding chemicals inside the bubble solution or by modifying the surrounding environment conditions. Therefore, we believe that the use of DNA nanotechnology inside soap bubble membranes is completely feasible.
REFERENCE
DN Kim, F Kilchherr, H Dietz, M Bathe. Quantitative prediction of 3D solution shape and flexibility of nucleic acid nanostructures. Nucleic Acids Research, 40(7):2862-2868 (2012).
Douglas, S. et al. (2009) “Self-assembly of DNA into nanoscale three-dimensional shapes”. Nature, 459(7245): 414-418
Duckett, D., Murchie, A. and Lilley, D. (1990) “The role of metal ions in the conformation of the four-way DNA junction”. The EMBO Journal, 9(2): 583-590
Hernández-Ainsa, S., Bell, N. A. W., Thacker, V. V., Göpfrich, K., Misiunas, K., Fuentes-Perez, M. E., Moreno-Herrero, F., & Keyser, U. F. (2013). DNA Origami Nanopores for Controlling DNA Translocation. ACS Nano, 7(7), 6024–6030. https://doi.org/10.1021/nn401759r
H. Dietz, S. M. Douglas, W. M. Shih, Folding DNA into twisted and curved nanoscale shapes. Science325, 725 (2009).
Mariurt, J. and Doty, P. (1961) “Thermal Renaturation of Deoxyribonucleic Acids”. Journal of Molecular Biology, 3: 585-594
Ohmann, A., Göpfrich, K., Joshi, H., Thompson, R. F., Sobota, D., Ranson, N. A., Aksimentiev, A., & Keyser, U. F. (2019). Controlling aggregation of cholesterol-modified DNA nanostructures. Nucleic Acids Research, 47(21), 11441–11451. https://doi.org/10.1093/nar/gkz914
P. W. K. Rothemund, Folding DNA to create nanoscale shapes and patterns. Nature 440, 297 (2006).
Petersen, P., Tikhomirov, G.,& Qian, L. (2018). Information-based autonomous reconfiguration in systems of interacting DNA nanostructures. Nature Communications, 9(1), 5362. https://doi.org/10.1038/s41467-018-07805-7
Qian, L.,& Winfree, E. (2011). Scaling Up Digital Circuit Computation with DNA Strand Displacement Cascades. Science, 332(6034), 1196–1201. https://doi.org/10.1126/science.1200520
Stahl E, Martin TG, Praetorius F, Dietz H. Facile and Scalable Preparation of Pure and Dense DNA Origami Solutions. Angewandte Chemie (International Ed in English). 2014;53(47):12735-12740. doi:10.1002/anie.201405991.